| Published October 14,
2019 (http://www.novelc.com/volatility_study.htm)
|
||
|
Correlation Between Volatility and Predictable Price Actioná
Novel C Corporation
Abstract It iságenerallyáacceptedáthatávolatility in the stock market is a reflection of fear, so much so thatáthe VIX, or Volatility Index, hasábeen dubbed the "fear index". While buy-and-hold strategies view volatility as a negative, it was wondered if volatility itself could be harnessed as a market force to predict price action (predicting the exact direction of a security). During the trading year of 2018, a set of 6 volatility-sensitive trading systems were able to attain 61.6% accuracy on 582 trades on the S&P Broader Market ETF (SPY) by predicting its price direction. These trades would yield 19.06% profit (5,062 basis points) on the SPY while the S&P 500 itself would lose 6.59% for the year.
Volatility has been defined as the range and speed of price movements [2]; the greater the volatility, the greater the amplitude of price. In our study, the CBOE Volatility Index, or VIX was used as our unit of measurement for volatility [3]. Volatility itself, however, can be categorized into five types: 1) Price Volatilityá 2) Stock Volatilityá 3) Historical Volatility 4) Implied Volatility and 5) Market Volatility [4]. In our study, price, stock and market volatility are most pertinent and are summed up simply as "volatility" (as the S&P 500 ETF encapsulates all three). While historical and implied volatility are measures that options traders use to attempt to predict future volatility, they were not used in our study as our aim was to predict the direction of securities and futures in real time. Although the years of 2016 and 2017 provided some of the lowest periods of volatility since the 2008 financial crisis [5], the US stock markets in the year 2018 were in for a drastic change [6]. Historically high volatility reigned as wild gyrations in price left investors bewildered on an almost daily basis. Although these wild swings wrought havoc on longer-term positions, it was postulated that if such gyrations could be harnessed there could be opportunities to be had.á
This dynamic range of price action in 2018 providedáa unique backdrop for trading systemsádesigned to profit from
wild swings in stock prices. These trading systems, collectively called the Volatility Engine, or VE, were a series of 6 systems that were designed to run during regular US marketáhours. The SPY ETF was used as the vehicle of trade representing the market as a whole.á As a corollary, trades of the S&P 500 Futures, or E-Mini futures were also experimented with in real time.áá
In this section, the indicators, time frames, execution details, and basic methodologies of the 6 systems comprising the Volatility Engine are described.á
While hundreds, if not thousands of trading indicators exist, the indicators used in our study were whittled down to under 10 (determined after thousands of hours of experimentation and testing). Not all indicators were deployed by all six systems, but varying combinations along with varying settings of each indicator were used.á Some of the indicators used include: ADX - Average Directional Index
Due to the nature of volatile markets, speed was of the essence; speed in reacting to price movements as well as speed in execution of trades. Indeed, when the S&P 500 was gyrating more in one day on a percentage basis than it had for weeks before, the ability to react to such forceful price moves quickly became apparent [7]. For these reasons, time frames across the six systems would feature 2 hour, 1 hour,á 30 minute, 15 minute, 5 minute, 3 minute, 1 minute, and even sub-1 minute time intervals for entry and exit decisions.
Although time frames greater than 2 hours had been explored, it was found that the accuracy of trades seemed to increase as time frames decreased.
The sheer capacity of the SPY ETF (trading $18.3 billion daily) provided the greatest chance of executing positions at any given moment in time, and thus, gave our systems the greatest chance of accurate order execution [8]. Entry conditions among the six systems varied depending upon market conditions, price formations, price levels as well as other criteria. Exit conditions among the six systems entailed criteria such as those listed above but also included stop-loss orders with pre-determined percentages. The trades were executed upon the S&P 500 ETF (Ticker: SPY) via online broker in the United States by means of both limit orders and market orders (depending upon market conditions) and were routed through the New York Stock Exchange (NYSE). Likewise, trades executed with the S&P Futures contract (E-Mini) were via online broker in the United States by means of both limit orders and market orders (depending upon market conditions) and were routed through the Chicago Board Options Exchange (CBOE). Execution of trades could be made by hand or by automated software.á When liquidity or other factors prevented execution of trades (whether stock or futures), simulated trades were executed with the same entry and exit parameters.áá A theoretical standard position size of $100,000 US was traded on the SPY, however, the actual amount was limited by capacity and other execution / market factors at different times throughout the study. Execution of the corollary S&P 500 Futures, or E-Mini Futures, was attempted when high probability trade conditions arose across the 6 systems. The futures lot sizes ranged from 1 up to maximum fund capacity.
- Anticipation of direction change The usage and interpretation of trading indicators objectively guided the entry and exit parameters of all six systems.á
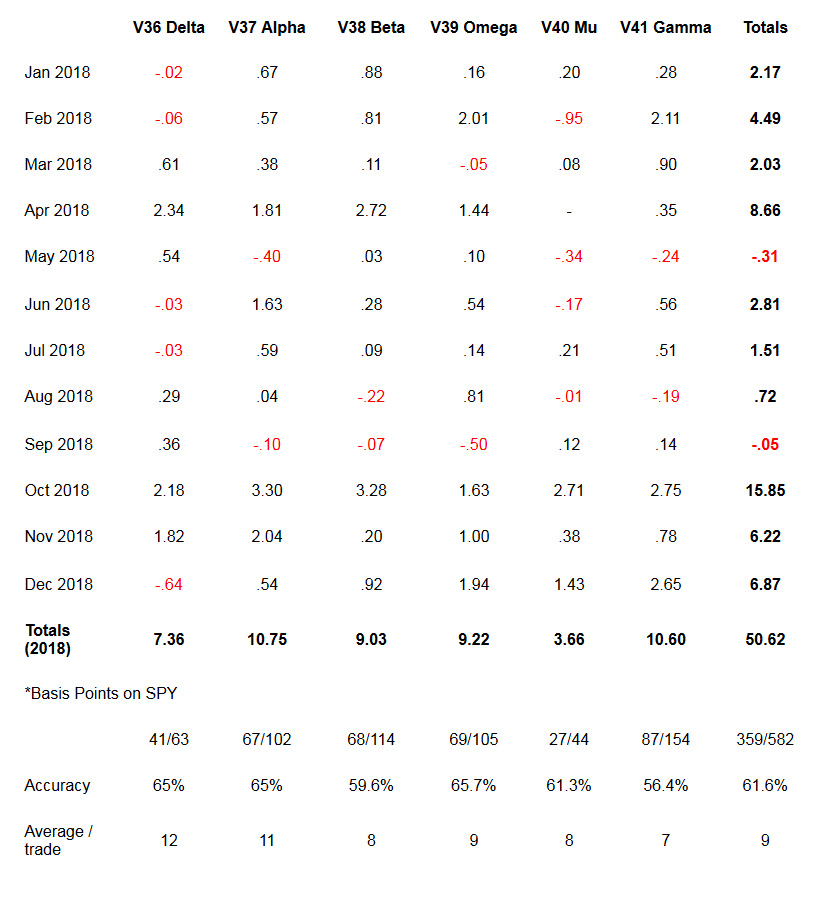
Results from the 582 trades across the 6 Volatility Engine trading systems
for the year 2018 are presented below.
A system by system monthly breakdown of the cumulative basis points
gained on the SPY is in the table below:á áá
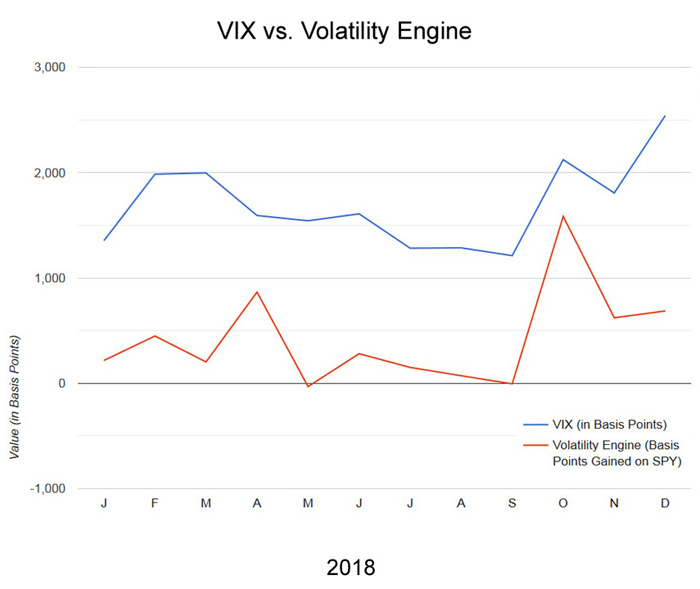
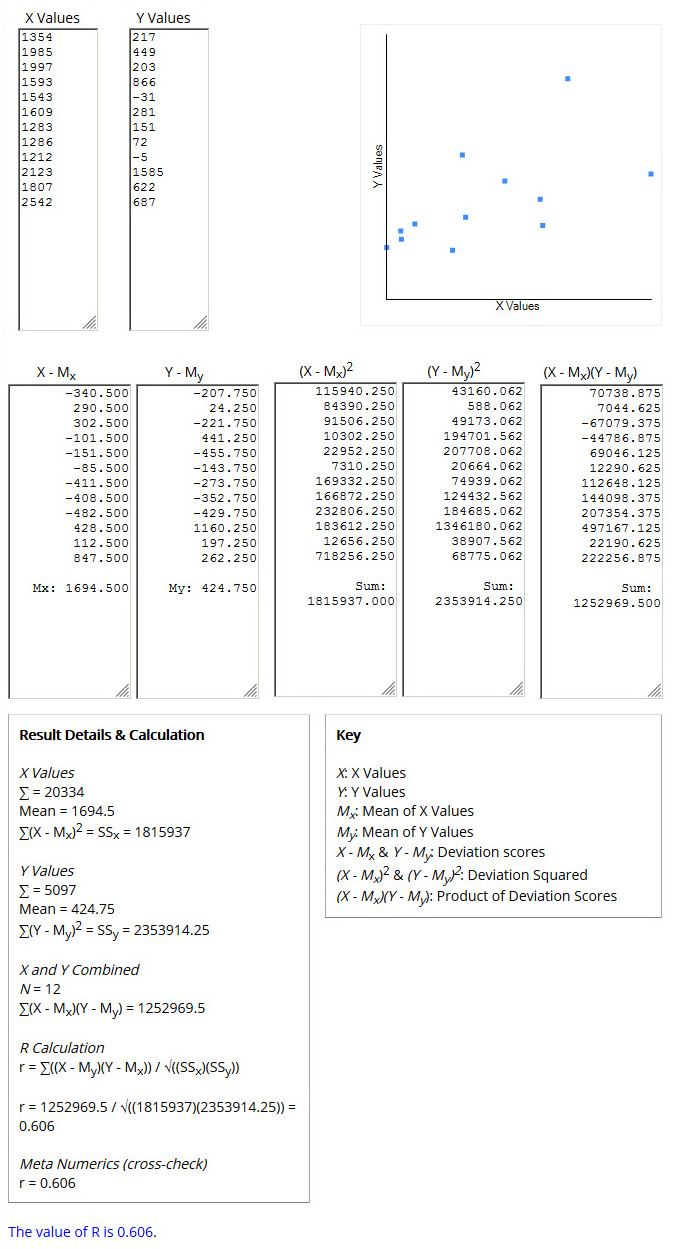
When using the data set of VIX (in basis points) and the Volatility Engine (in basis points on the SPY gained) to obtain an R Value of 0.606, plot and calculations are below:
The VIX and Volatility Engine were found to be positively correlated, r(10) = .61, p = .037
In terms of the effectiveness of the systems, the phenomena of catching extreme price movements early seemed to be evenly matched with gains that
capitalized on the continuation of extreme price moves. This
could have been a function of the conviction behind the huge price swings
of 2018. Commissions also played a factor in the profitability of the Volatility Engine. Though a small percentage of the capital traded, commissions added up when trading north of 500 trades. (The commission to trade the SPY was flat $9.90 round trip - to buy and sell, or to short and buy to cover). Unforeseen factors that negatively impacted the Volatility Engine's results included (but were not limited to): technical glitches due technology constraints, technological glitches experienced from broker data feeds, technological issues dealing with internet bandwidth and reliability, exchange data issues (both NYSE and CBOE), human error (whether by execution by hand or by software coding issues) and even physical hardware issues. Despite slippage, commissions, and numerous unforeseen factors, the Volatility Engine's performance in 2018 in both real money and in simulated trades outperformed holding the SPY throughout the year. The statistically significant correlation between the VIX and the VE was a welcome phenomena when markets seemed to be unable to decide which way to go. Were the Volatility Engine results of 2018 a fluke? To further explore the nature of volatility, we would observe how the systems would do on the first half of 2019.
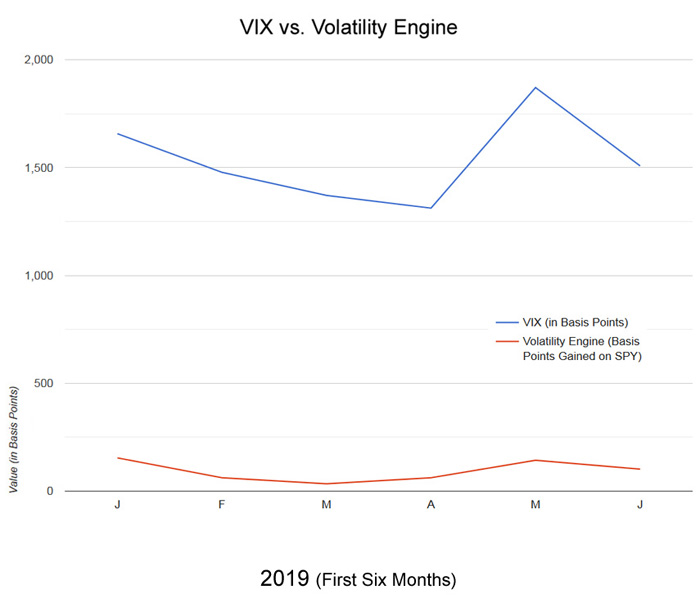
3.4 Combined Results of the 6 Volatility Engine Systems (First Six Months of 2019)
A monthly breakdown of the cumulative basis points on the SPY gained is in the table below:á áá
When comparing the data sets of the VIX (in basis points) and the Volatility Engine (in basis points on the SPY gained), results were below:
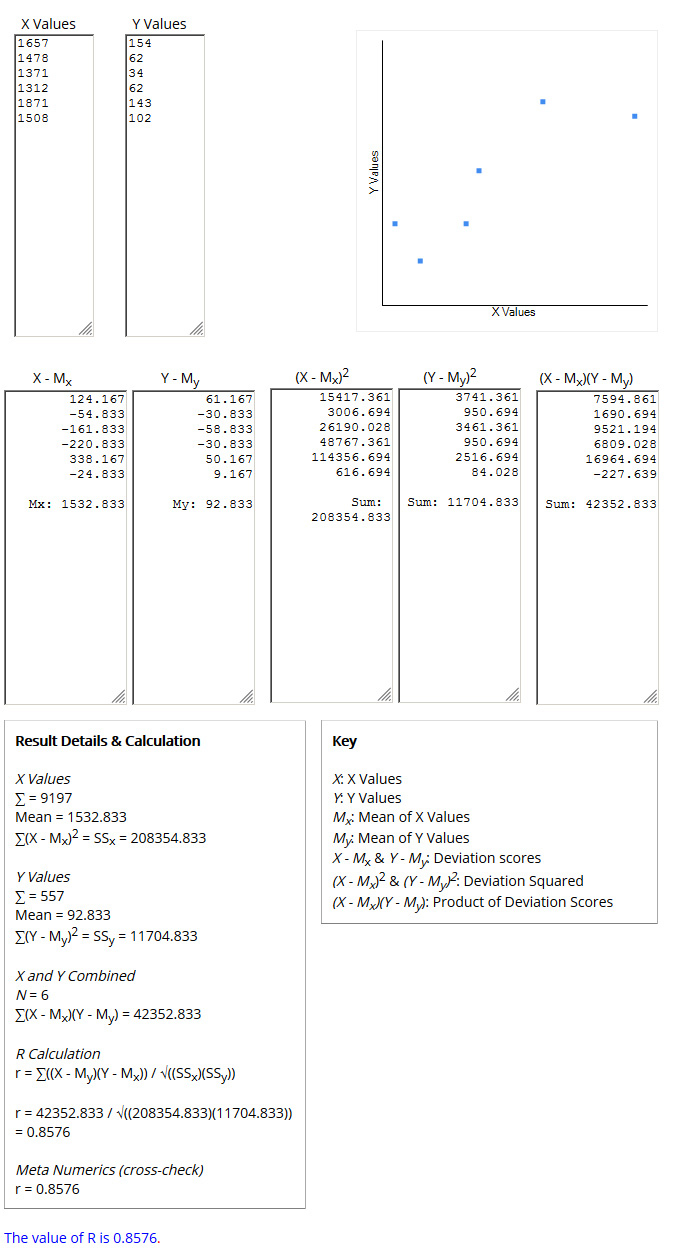
When using data set of VIX (in basis points) and the Volatility Engine (in basis points on the SPY gained) to obtain an R Value of 0.8576, the plot and calculations are below:
For the first half of 2019, the VIX and Volatility Engine were found to be positively correlated, r(4) = .86, p = .029
3.6 Discussion of Results for the First Six Months of 2019
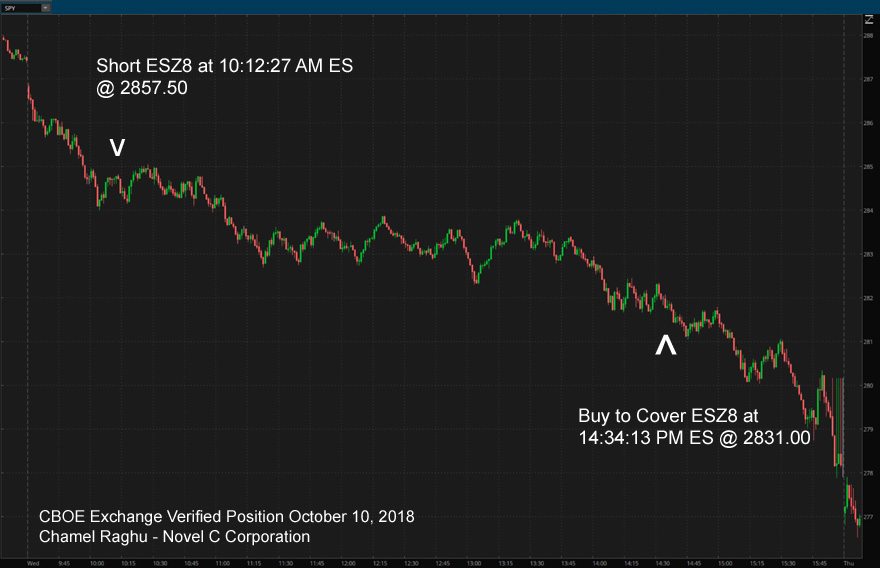
Chart: SPY 1-minute candle Trade Vehicle: ESZ8 (S&P 500 Futures E-Mini Contract) Entry Details: Short 10:12:27 AM ES @ 2857.50 Exit Details: Buy to Cover 14:34:13 PM ES @ 2831.00 Entry Capacity Range: 1 Lot to Maximum Fund Capacity of 700 Lots Profit Range: 1 Lot = $1,319.60 to 700 Lots = $923,720.00 (before exchange fees and commissions) CBOE Exchange Verified Position
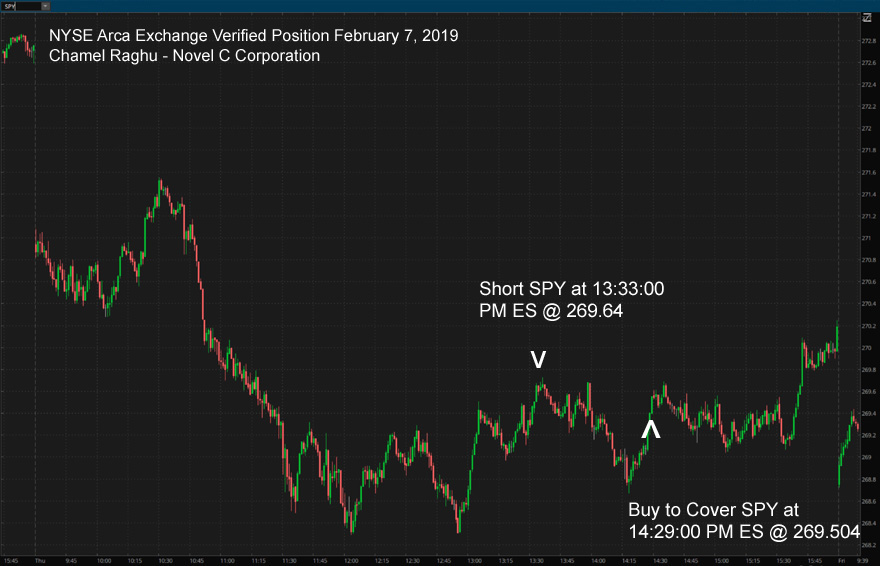
February 7, 2019 Chart: SPY 1-minute candle Trade Vehicle: SPY ETF Entry Details: Short 13:33:00 PM ES @ 269.64 Exit Details: Buy to Cover 14:29:00 PM ES @ 269.504 Entry Capacity Range: 1 Share to 374 Shares ($100,000 Share Size Limit) Profit Range: 1 Share = $0.05 to 374 Shares = $19.41 (before exchange fees and commissions) NYSE Arca Exchange Verified Position
Within the financial realm, studies dealing with volatility are exhaustive. However, they tend to address either assessing risk for long term investments [9], or in utilizing volatility for predicting future volatility by options traders [10]. The prediction of stock direction as a direct result of volatility was an idea we felt was unexplored, and, even ran counter to conventional wisdom. Indeed, it is widely regarded that "In stocks, volatility increases as stock prices decline, and volatility declines as stock prices increase" [Yates, 11]. While this may be generally true for long term investors, it is not true for traders, according to the findings in our study.
5.1 Volatility Can be Used to Predict Price Action The statistically significant correlation between volatility and predictable price direction on the broader market provided a new way for stock traders to view volatility: one not of fear, but of opportunity. Also encouraging is the fact that profits could be had not just during a volatile year, but even during periods of low volatility (like the first half of 2019). This "hedge" against volatility runs counter to the conventional means of hedging against volatility, i.e. buying VIX futures contracts (VIX contracts were down 49.7% while the VE was up 1.97% the first half of 2019). While the results for trading the Volatility Engine showed promise, a paradox arose.
5.2 Capacity Concerns - A Volatility Paradox Our trading experience during the execution of the Volatility Engine gave rise to an unexpected phenomena: capacity constraints. While periods of high volatility are by definition caused by large volumes of shares changing hands, it was found that on smaller time frames capacity could shrivel up. This was in the 'heat of the moment' of volatility; the times when volume was spiking (true for the SPY or S&P 500 futures). Our observation that exploiting volatility requires trading smaller time frames, coupled with execution issues at those smaller time frames, created a volatility paradox. Instead of executing our trades on the New York Stock Exchange or the Chicago Board Options Exchange, many trades become executions on paper (whether due to partial fills, or lack of capacity altogether). This meant that though on paper the Volatility Engine's results tracked volatility with a statistical significance, the actual executions of trades were found to have a large variance of accuracy regardless of position size (and this on the world's largest traded security, the SPY). Thus the return of 19.06% on the SPY represented optimum trading results (including both real and hypothetical positions). This failure to execute trades consistently on smaller time frames lead to the desire to scale without such constraints, and to the exploration of the other side of price action... Momentum.
5.3 Takeaways
- A statistically significant correlation between volatility and predictable price action on the SPY was observed - During the market turmoil of 2018, the Volatility Engine gained 19.06% while the SPY lost 6.59% - During periods of low volatility (first half of 2019) the Volatility Engine yielded a 1.97% profit (versus a 49.7% loss if buying VIX contracts) - To capture volatility, one must seek smaller time frames, but at smaller time frames orders are harder to fill (Volatility Paradox)
[1] Silver, Caleb (2019, June 20). What Does the S&P 500 Index Measure and How is it Calculated?. Retrieved from Investopedia website: https://www.investopedia.com/ask/answers/040215/what-does-sp-500-index-measure-and-how-it-calculated.asp
|
||
|
|